

by Sasha Alyson
In 2010, the U.N.’s Food and Agriculture Food and Agriculture Organization published data about hunger levels. Here’s how many people the FAO said had been undernourished two decades earlier:(1)


That 843.4 million figure suggests a high degree of accuracy. You can be reasonably sure, for example, that the number wasn’t closer to 800 or 900 million.
Let’s look at that again, next to FAO’s 2015 report:

Now what are you sure of?
Fun with the CIA
Here’s a funnier example. The CIA publishes an online World Factbook, compiling hundreds of statistics about every nation. For Tonga:(2)


That’s right, somebody typed in the year, 2006 – twice – instead of the statistic they were supposed to copy. This error has been posted at least since 2017.
Anybody can make a mistake like this. I have, surely you have too.
But it’s quite simple to set up a data-input system that will reject such impossible entries, and which also checks overall plausibility. (In this case: Add up all three numbers, the total should be within a narrow range, not exceeding 100.) An intelligence agency ought to have staff capable of realizing that such safeguards are needed, and getting them in place. In a situation where so many numbers are being updated so often (or, for Tonga, not so often), then posted by a major government agency which wants to be used as a source of data, wouldn’t it make sense to invest a little extra effort, so you don’t look stupid?
Here’s what the CIA World Factbook says about Laos:
Languages: Lao (official), French, English, various ethnic languages
No one in Laos would create such a list, unless their research consisted of eating at the pricier restaurants in the capital. Which perhaps it did. But if your middle name is “Intelligence,” you should really try harder. Two ethnic groups, the Khmu and Hmong, each represent about 10% of the population. Each has its own language. Either group represents far more speakers than French and English combined. As for non-native second languages, English is far more common than French, despite well-funded efforts from Paris. Did the U.S. lose its war in Southeast Asia because American spies were crawling through the mountains of Laos, hoping to get by with French phrasebooks? And why does the CIA name only secondary languages only of former colonial powers, not of the people who live in a country?
Literacy: Two ways to count
One more. In 2014, Unesco reported adult literacy on the Pacific island of Vanuatu at 84.7%. A survey in Vanuatu’s largest province in 2011 had indeed found that 85% of adults “declared they could read and write a simple letter.” So far, so good. Then the Asia South Pacific Association for Basic and Adult Education actually tested adults: “Individual testing confirmed that only 27.6 percent were literate.”(3)
Fobos: Fear Of Blank On Spreadsheet
Several factors are at work here. Hunger numbers for 1990-92 took a big jump upward, just in time for a 2015 report in which the U.N. wanted to report great progress in reducing hunger since 1990. Bigger numbers from 1990 meant a greater drop in the intervening years — an extra 167.2 million people were no longer hungry. Was that why the 1990-92 numbers so conveniently jumped up? If so, nobody’s talking.
There’s another factor in all three cases. I’ll call it FOBOS: Fear of Blank On Spreadsheet. These agencies – the U.N. most of all — are driven to fill blanks on their spreadsheets, accuracy be damned. The U.N. explains that in some cases,
“countries do not produce the data required for the compilation of indicators. When this occurs, international statistical agencies make estimates based on the data of neighbouring countries or of countries with similar levels of income.”(4)
If your jaw didn’t just drop, you should probably read that again. In a nutshell: if there’s no data, they invent it.
Why? In the CIA’s case, it wants people going to the CIA World Factbook to get their facts, and if some facts are missing, people might get in the habit of looking elsewhere. If you control information, you’ve got an edge when it comes to controlling other things. Often, there are conflicting data; you can decide which people see. And you shape the conversation. In the CIA’s Economy section, the first 8 statistics are all about GDP. Further down there is one statistic about poverty; and none about income inequality.
As for the United Nations: The U.N. was founded to promote world peace and to work for human rights and social progress. But just as in every large institution, the official goals have long since been overtaken by another: Institutional survival and growth.
Most of the U.N. budget comes from “development” work, not from preventing war. The U.N. must convince the world that it knows what it’s doing.
The best approach would be for the U.N. General Assembly to seek independent, objective evaluations of U.N. work by genuine representatives of the people it claims to be helping. It’s not going to do that. There’d be no controlling what they’d say! Instead, the U.N. evaluates itself.(5) And for extra credibility, it publishes row after row, chart after chart, report after report, that make it look as if it knows every detail of what’s going on. Even when it doesn’t have a clue.
Notes and Sources:
1. FAO tables are from its State of Food Insecurity in the World (SOFI) reports for 2010 (p. 50) and 2015 (p. 54). This link takes you to a page where you can download SOFI reports.
Others have called attention to these changing hunger numbers. Martín Caparrós in a New York Times opinion piece points out that FAO had raised the 1990 figure four times as of 2014; and had made similar, often even more substantial, changes in the past. “How We Count Hunger Matters,” (if you click this link, the article will download immediately) by Frances Moore Lappé et al., puts this issue in the context of the bigger struggle to end hunger. Thomas W. Pogge explores this and other ways that wealthy nations abuse their power in Politics as Usual: What Lies Behind the Pro-Poor Rhetoric. Yet the mainstream media has accepted, at face value, whatever the U.N. puts forth. Pogge writes: “Thousands of economists, statisticians, and other academics understood what was happening. So did thousands of people in the media, who had been reporting on the Rome Summit and the MDGs – with some of them expressly denying that the revisions were worth reporting.”
Here, again, are the FAO tables. They reveal further evidence that accuracy wasn’t a top FAO concern, in a way that I don’t believe has been noted before. In its 2012 SOFI report, FAO explained that new data in five categories, such as food loss during distribution and population estimates, had compelled it to increase its hunger estimates for 1990-92. That’s why, in the 2015 report, hunger figures for developing regions increased by 19.85%. FAO didn’t report that it had new data for the “developed regions.” But if you increase the earlier 16.7 figure by 19.85% you get 20.0 — precisely what FAO reported as the new figure. It defies belief that data from opposite regions required exactly the same level of correction. It would appear that someone at FAO had to fill in a blank for the revised “developed regions” spot, and arbitrarily increased it by the same ratio.
2. CIA screenshots are from its World Factbook for Tonga and Laos, accessed on 13 March 2020.
3. The literacy test is reported in “The Classrooms Are Full – but the Students Can’t Read,” by Catherine Wilson, IPS News, 7 July 2013. ASPBAE surveyed 1,475 people in Shefa Province, home to the capital and about 36% of the population. Ideally we wouldn’t compare a province with the country as a whole. However, it seems likely that a province holding the capital would have a literacy rate at least comparable to, and probably higher than, the country as a whole. The Unesco Institute for Statistics website, accessed on 19 May 2019, shown below, gives Vanuatu’s adult literacy as 84.7%.


4. The Millennium Development Goals Report 2005, United Nations, New York, 2005, p. 42. The Millennium Goals Reports page of the U.N. website offers a choice of downloading the full reports, or a progress chart, for each year from 2005-2015.
5. “The U.N. evaluates itself.” Actually, the U.N. prefers to avoid any accountability at all. But when evaluations are needed, or will be useful, the U.N. does the job itself. Those 1990 FAO hunger figures jumped up just in time for the U.N.’s 2015 report on its Millennium Development Goals, which Secretary-General Ban Ki-moon declared to be “the most successful anti-poverty movement in history.”
The U.N. knows how to avoid accountability, when it needs to. Through criminally bad sanitation practices, U.N. peacekeepers set loose a cholera epidemic in Haiti which is estimated to have killed 10,000 people. The U.N. covered up evidence, stonewalled about its role, then when the evidence was overwhelming, declared that it could not be held accountable…. and it never has been. I highly recommend Rasna Warah’s short, powerful book Unsilenced: Unmasking the United Nations’ culture of cover-ups, corruption and impunity for more reading on this topic.
Related stories


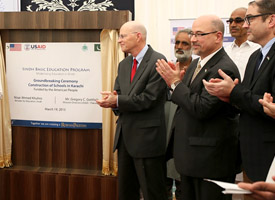
Right: USAID funds a new education program in Pakistan. But the problem isn’t a lack of funding, the problem is that those who should be improving schools, are instead keeping an eye on the money.


Right: Gender parity in education. Our map on this subject, drawn from UNESCO data proved quite controversial, and there are issues with it — though not what you might expect. For one thing, UNESCO bobbled some data.

Right: The Bill & Melinda Gates Foundation vows transparency. But its database search function is broken. How hard is Bill trying?
Other stories of interest


Right: What would make a better future? There are ways that wealthier countries can genuinely help others, if they want to. Give the aid money directly to the poor, for example. Here are ideas.